Performance improvements in user data
Version 7.50 includes an efficient new option for storing and retrieving user data (dashboards, collections, etc.). If configured, this enhancement can provide significantly improved login times, especially in configurations with many users and large amounts of user data. In addition, user data management will be improved when load balancing.
How it works: A user data service stores the user data efficiently by segregating it into metadata and corresponding user data components. Salient Dashboards and other Salient client applications can then load the data on an as-needed basis to achieve optimized response times. Additional installation and configuration are required. The traditional user data option is still available if your organization does not wish to utilize the user data service.
Improved design options
Custom color palettes
Enhance graphs using custom color palettes. Just pick a color palette in visual options to apply its colors to a graph. Salient Dashboards come with a set of built-in color palettes; in addition, your organization can configure its own custom color palettes.
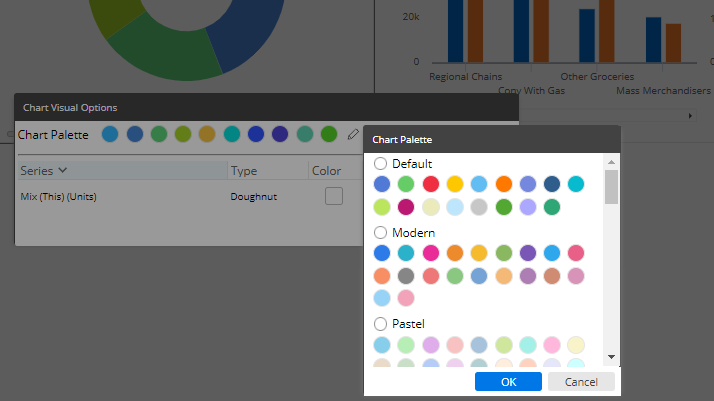
* Your organization can choose a default color palette to automatically upgrade colors in existing dashboards. See the Salient Dashboards Installation and Configuration Manual for more information.
Visual options for mix widgets
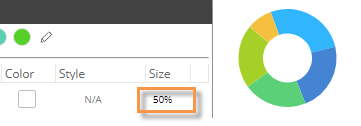
Mix graphs have visual options, including color palettes and a new option to adjust the size of the doughnut center.
Better control over widget layering
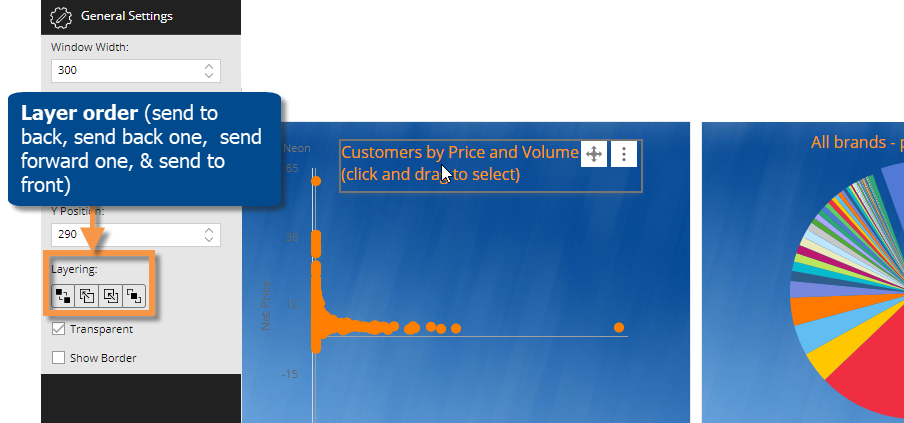
Dashboard Designers can control the layering order of widgets to determine which widgets appear in front of others. This enhancement helps the design process and keeps widgets in place for end-users, because the order does not change in view mode. For example, multiple overlapping widgets, such as analyses, images, and captions will keep the same display order regardless of where the user clicks. Layer ordering
is available in general settings of edit mode.
Highlight totals, averages, and subtotals
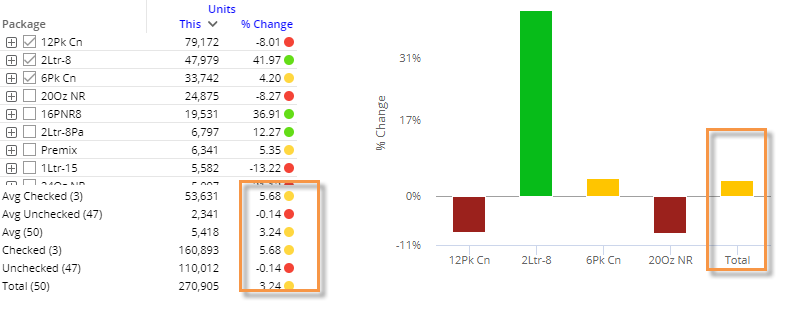
Highlight settings can be applied to totals, averages, and subtotals (i.e., checked/unchecked members) in grids and graphs. This new capability makes it easier to identify summary metrics that fall within or outside of the expected ranges.
SSO authentication
This version supports SSO authentication using the new Salient Authentication Service and an external Identity Provider (IdP). In this configuration, Salient Dashboards and other Salient client applications can authenticate users based on credentials from another system. This authentication method requires additional installation and configuration, including the Salient user data service. Contact Salient for more
information.
More control over data exploration
Administrators can choose which users have access to explore mode where they can perform advanced data investigation. These rights are applied per user group in the Administrator’s Utility. As in the previous version, explore mode may also be turned on/off globally for all users.
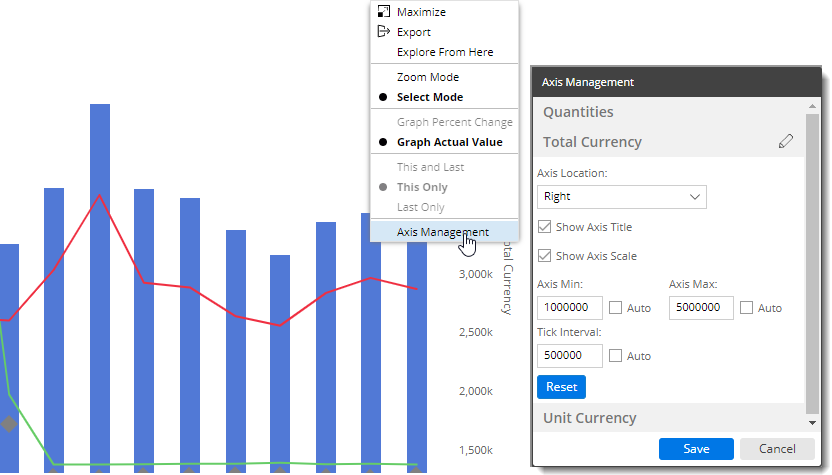
Graph axis customization (in V7.51)
This version provides better control over axes in actual value and percent change graphs. A new axis management area provides streamlined access to setup options, including location, title, minimum, maximum, and tick interval. To access these settings, go to the widget menu or graph settings in the toolkit.
Version compatibility:
Required Server/Metaserver version: 6.0.222 through 6.0.231. In general, the latest V6 server (currently V6.0.231) is recommended.
Compatible SIM versions: 7.50 through 7.70
Learn more about Salient Dashboard versions: