Faster dashboard export
(in V8.3.6+)
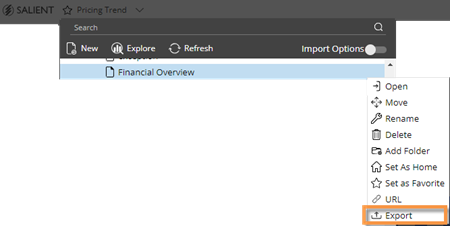
You can export a dashboard to a file without opening it first. This new option is available in the dashboard menu
Easier setup for comparative trend graphs
(in V8.3.6)
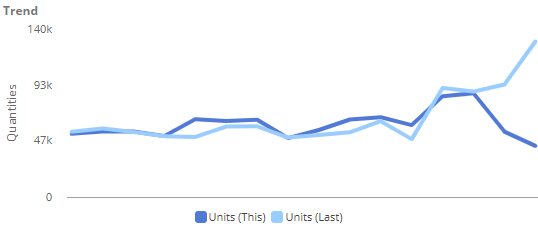
A Trend graph that has two date ranges (This and Last) will automatically show both timeframes. As always, you can choose your preferred timeframe option (This and Last, This only, or Last only) in the widget menu.
Comprehensive options for notifications
(in V8.3.4+)
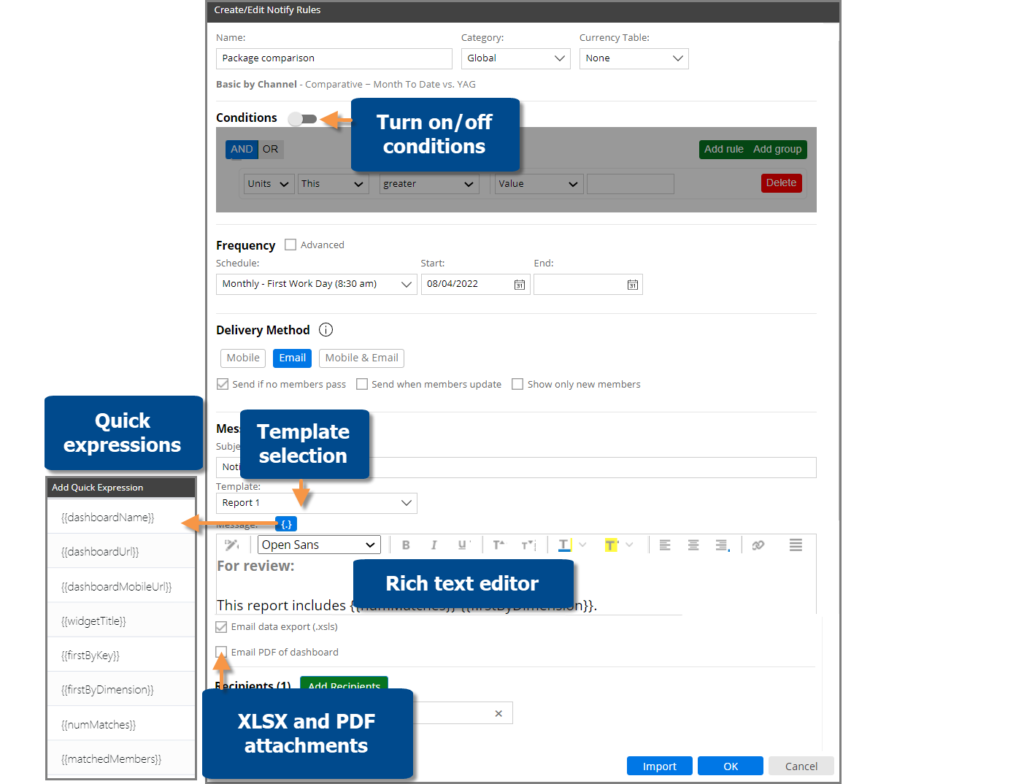
- Better automated reporting – Notifications no longer require conditions; therefore, they can be used for automated reporting that doesn’t depend on test criteria.
- Excel and PDF – Attach Excel spreadsheets and/or PDFs to email notifications.
- Templates – Design multiple HTML templates to control the appearance and content of email notifications.
- Improved flexibility – Optionally, create different messages for mobile and email.
- Rich text editor – A rich text editor provides more formatting options for email messages.
- Quick expressions – Just point and click to insert any of several variables, such as the dashboard URL, mobile URL, dashboard name, number of members, or a list of members into the message.
Watch a video:
Grid improvements
- This version provides better performance in large grids with many columns.
- Grids have an updated appearance. For example, expand multiple levels of data using streamlined arrows instead of plus buttons.
- A new option provides endless scrolling within a single page. When infinite scrolling is on, users can simply scroll down to see more members; data continuously loads to provide a seamless viewing experience. (Infinite scrolling is not available if auto-expand is on.)
- After resizing a column, you can save your changes in the dashboard if you want to keep a custom column width. To change the column width back the default (e.g., autosize), just select the reset option from the menu.
Merge collections
You can merge multiple collections together into new collections to facilitate creation and maintenance of custom filters. For example, merge multiple categories of brands together into a single collection. This new capability has several options to provide full control over which members are included in the new collection: merge all members, only common or “shared” members, only unique or “different” members, or members that belong to some collections but not others.
Shortcut to select multiple rows
(in V8.3.4+)
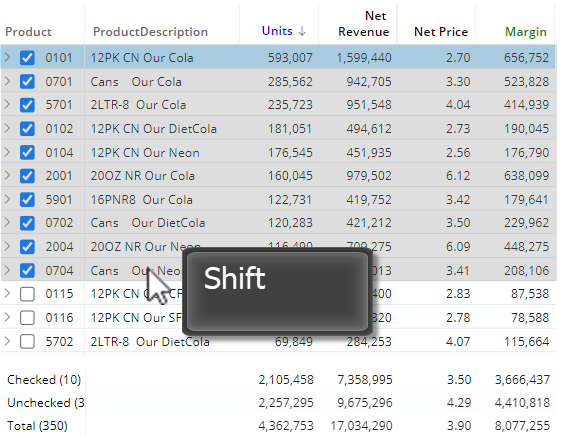
Press Shift as you click in a grid to quickly checkmark a block of data containing multiple rows. You can then view subtotals for the selected rows or investigate the members by drilling down, filtering on them, or graphing them.
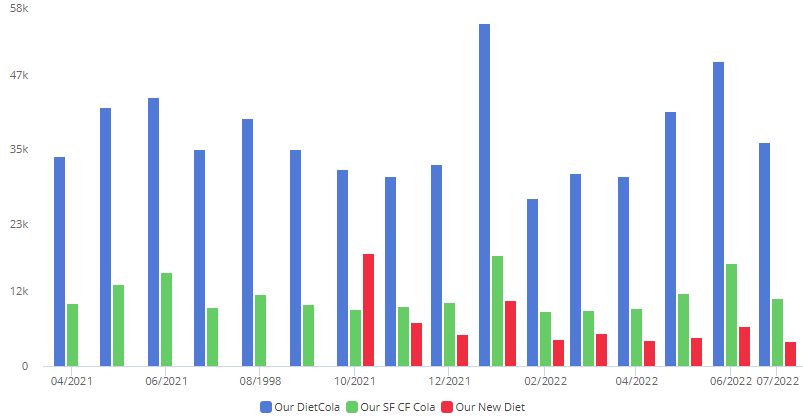
New share trend visualization
(in V8.3.4+)
An unstacked bar graph shows performance of multiple people, places, or things over time. The bars are arranged beside each other rather than stacked to provide a direct comparison of values. As always, you can customize the graph by choosing how many items display, a color palette, actual value or percent, and more.
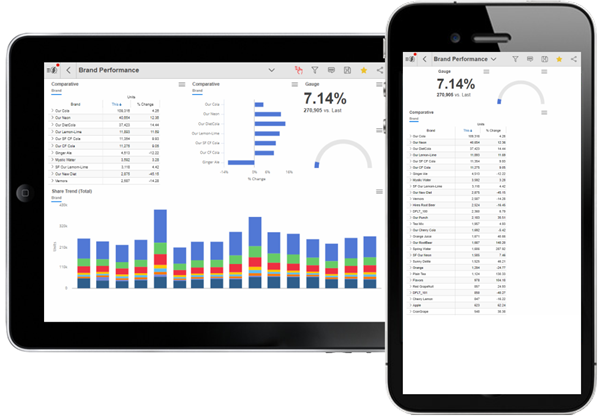
Better control over mobile dashboard layouts
(in V8.3.4+)
Mobile dashboard layouts can automatically show or hide widgets based on device size. This new setting provides better control over screen space in the mobile app. For example, a dashboard could show a large graph on tablets but hide it on phones.
Explore mode enhancements
Fewer clicks needed to explore (in V8.3.4+)
Opening or importing an “explore” dashboard (i.e., saved or exported from explore mode) will take you directly to explore mode where you can make changes like adding measures or changing the analysis type. In previous versions, these dashboards opened in view mode.
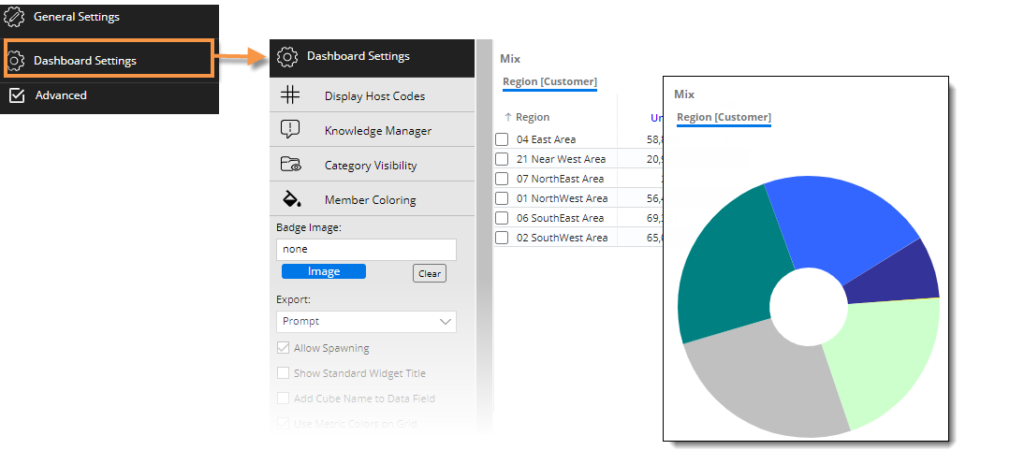
More options while exploring
Dashboard settings are now available in explore mode to provide more ways to customize the dashboard. For example, a user might turn on host codes or apply custom colors to a graph. Other dashboard settings include options for Knowledge Manager, exporting, widget title information, and more.
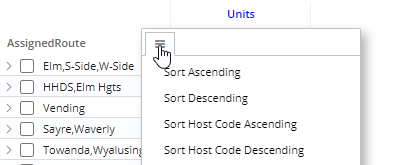
Sort by code or name
You can sort data by names or codes of dimension members (i.e., groupings) even if host codes are not currently displayed. Just click the column header and choose your preferred method of sorting.
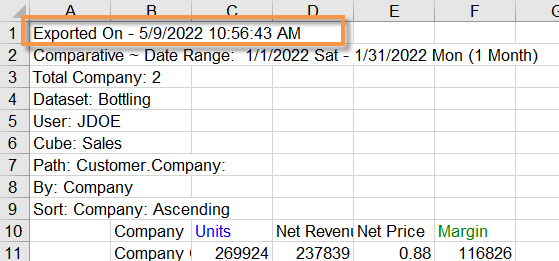
Information about exported files
An exported file header includes the export date to provide a record of when the file was generated.
An exported file header includes the export date to provide a record of when the file was generated.
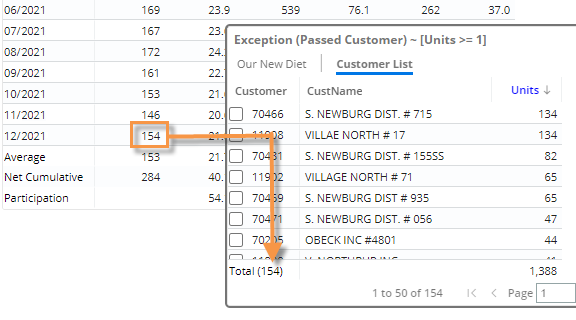
Smarter drilling in Exception Time Series grids with dynamic collections
In this version, drilling is more intuitive in Exception Time Series grids with dynamic collection filters. If you drill on passing or failing members for a specific date, the resulting list will use the original grid timeframe (e.g., all twelve months) when determining members that meet the collection criteria. The list will display the subset of these members that pass or fail the exception test on the given date. As a result, the number of members in the list will match the cell in original grid.
Improved usability
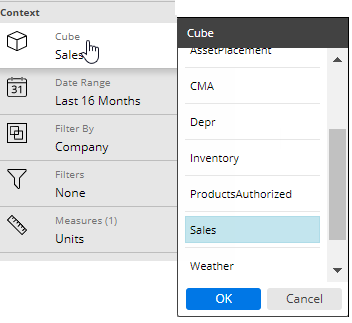
Cube sorting –
This version sorts cubes alphabetically to make it easier to find data.
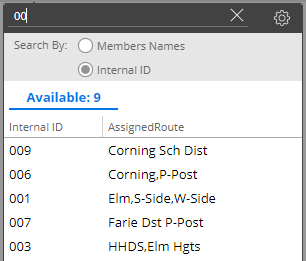
More information –
When searching or selecting members by code/ID, you can see names in addition to codes to more easily identify what you are looking for.
Security enhancements
This version improves security by encrypting cookies.
Version compatibility:
Required server version: 8.2 or higher
Compatible SIM version: 8.2 or higher
Learn more about Salient Dashboard versions: