Improved performance
This version provides significantly faster response times and better scalability due to improvements in multithreading on the UXT Server. On average, the UXT system will respond three to four times faster than previous versions. Even greater improvements (up to 1000x faster) are possible on large data queries.
Multi-dimensional data
This version provides fast new ways to access multi-dimensional data.
Watch an overview:
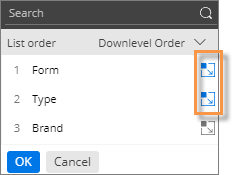
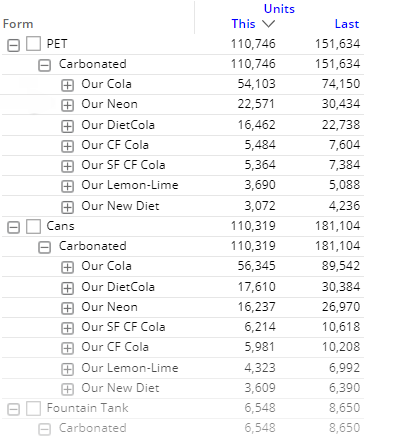
Faster tree expansion
You can automatically expand dimensions and keys to see underlying data. Just turn on auto-expand for a dimension or key; all its members will be expanded to the next level. You can expand multiple levels to create a customized tree of performance metrics.
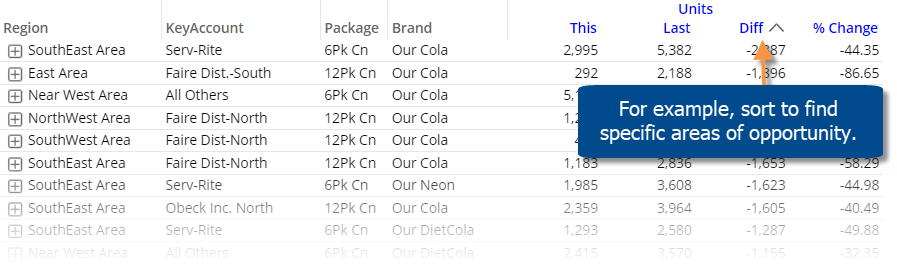
New multi-dimensional grid (i.e., flat view)
A new multi-dimensional grid expands dimensions and keys into columns to provide an interactive view of performance at any level. Each unique combination has its own row. You can sort the rows to find opportunities and drill down to investigate any cross-sections of data. This new grid is called a “flat” view because it removes the constraint of built-in subgroupings.
Improved exporting
This version makes it easier to export data to Excel and comma-separated (csv) files.
- Exporting is significantly faster than previous versions, especially when dealing with multiple levels and large amounts of data.
- This version removes the 1,000-member limitation on 2nd By members (except for record details).
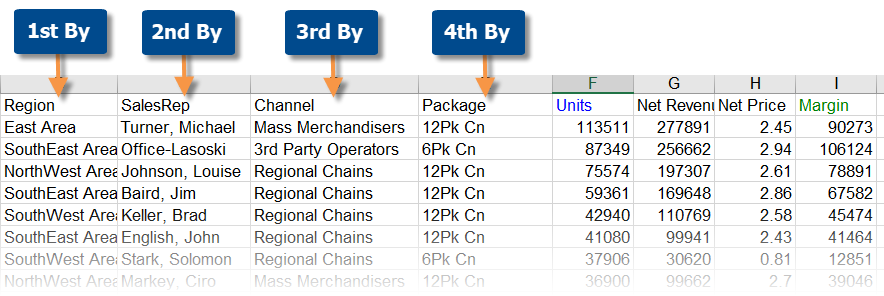
- You can expand data into additional levels beyond the 2nd By dimension to access detailed data outside of Salient Dashboards. Choose the level when you export. Each unique cross-section of data will have its own row. For example:
Multi-dimensional visualizations
You can visually compare multiple levels of data in graphs.
Watch an overview:
Expanded comparative graphs
You can expand dimensions and keys in Comparative and Multi Comparative graphs to view performance at a more granular level. The same powerful options are available for expanded charts: graph percent change or values; show vertical or horizontal bars, and so on. In addition, bars can be arranged independently or grouped under the parent level.
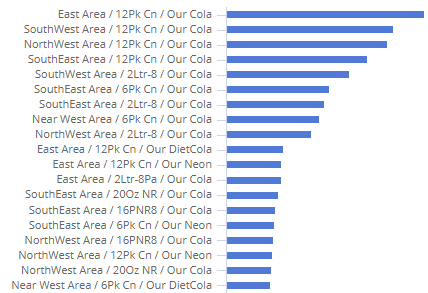
Independent bars:
Using the new “flat view” data, you can see separate, independent bars for each combination across multiple dimensions. For example, compare the top package/brand combinations across regions.
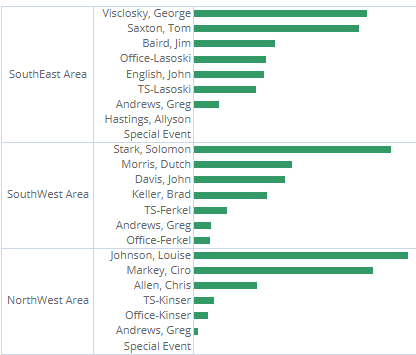
Grouped bars:
The graph can group bars under the parent level—allowing you to compare overall results as well as performance within a category. For example, which sales representatives have the highest margins across the company and within their regions?
Multi-level and key-level pie charts
You can expand mix graphs to see the percent contributed by cross-sections of the data.
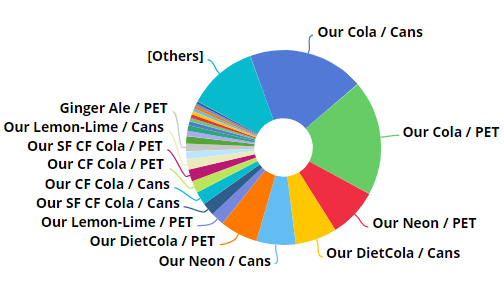
Independent pie slices:
Pie slices can be arranged in a single level to represent each combination’s percent of the total. For example, identify the top combinations of brand and package type.
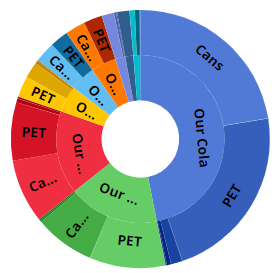
Sunburst:
Pie slices can be arranged in a series of rings to show the breakdown of data within multiple categories. The center ring represents the top-level data (1st By); the data becomes more granular as you move outward. For example, visualize the breakdown of package types within brands.
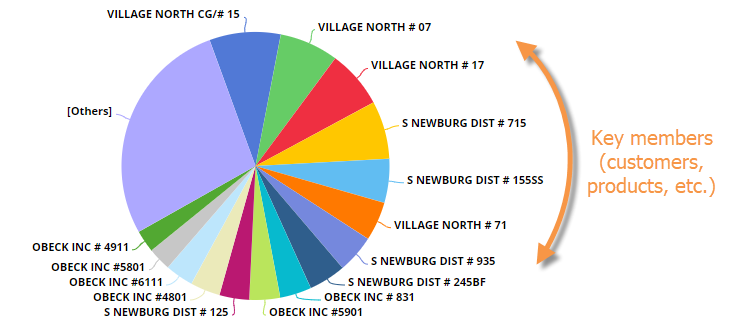
Key-level pie charts: The mix chart is now available at the key level (e.g., by customer) to show how much individual key members contributed to the total.
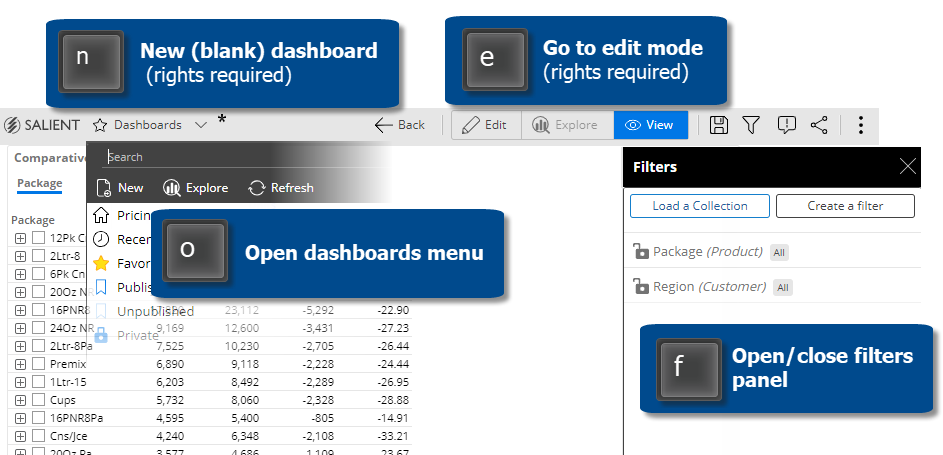
Keyboard shortcuts
Keyboard shortcuts let you quickly perform common tasks, such as opening the dashboard menu, switching between dashboard modes, opening the filter panel, selecting the workspace, copying/pasting, and more. For example:
Easier dashboard design
New features make it faster and easier to design dashboards.
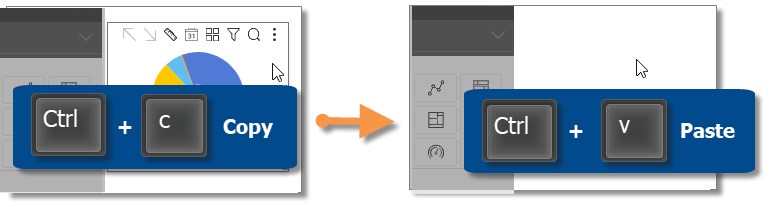
Copy widgets
You can quickly copy and paste widgets from one dashboard into another. Just select the widget and press Ctrl + c to copy; then press Ctrl + v to paste. You can also copy and paste within the same dashboard.
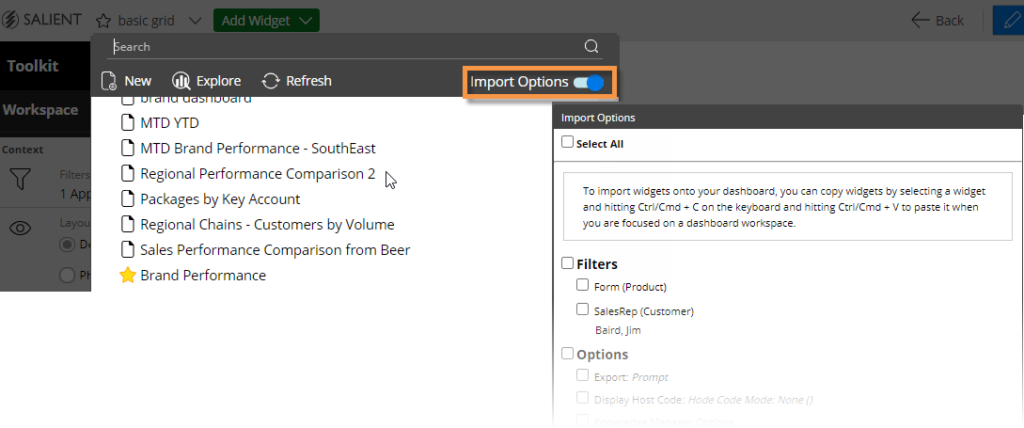
Import dashboard options
You can import options, such as member coloring, filters, and dashboard settings, from other dashboards to minimize setup time.
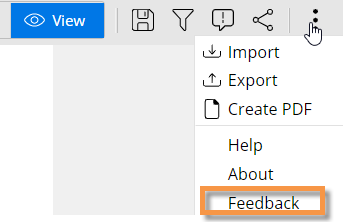
Contact Salient support
A new feedback tool makes it easy to contact Salient support and send information for troubleshooting. Feedback may include feature requests, bug reporting, requests for assistance, and general comments.
Version compatibility:
Required server version: 8.0 (no Metaserver available)
Compatible SIM version: 8.0
Learn more about Salient Dashboard versions: