Performance improvements in user data
Version 7.50 includes an efficient new option for storing and retrieving user data (bookmarks, collections, etc.). If configured, this enhancement provides the following:
- Significantly improved login times in configurations with many users and/or large amounts of user data
- Automatic refresh of user data
- Better management of user data when load balancing
How it works: A user data service stores the user data efficiently by segregating it into metadata and corresponding user data components. SIM and other Salient client applications can then load data on an as-needed basis to achieve optimized response times. Additional installation and configuration are required.
The traditional user data option is still available if your organization does not wish to utilize the user data service.
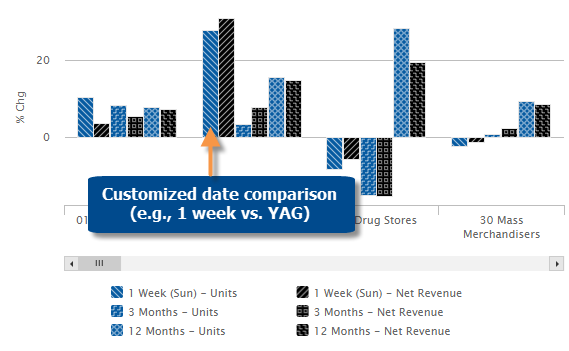
Visualize and compare multiple date ranges
The new Multi Comparative bar graph shows variance for any number of date comparisons and metrics. For example, visualize short-, mid-, and long-term results compared to the same time last year. The date ranges can be completely customized. Compare any combination of days, weeks, months, or periods to any other dates or budgeted goals. Like the Multi Comparative table, this graph is based on column setups that you can save and share with other users.
Choose which categories are important to you
This version provides more control over user data categories, which organize bookmarks, storyboards, collections, and other user data into folders. Using new preferences, you can choose which categories are expanded or collapsed when you open the bookmarks panel and various dialogs in SIM. This enhancement allows you to simplify the screen while keeping commonly-used components easily accessible.
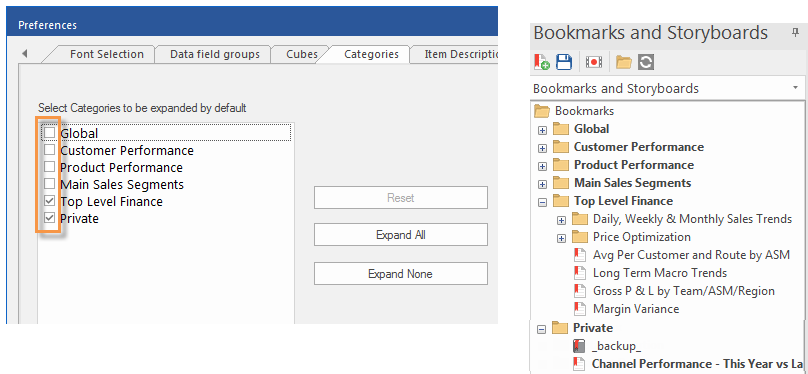
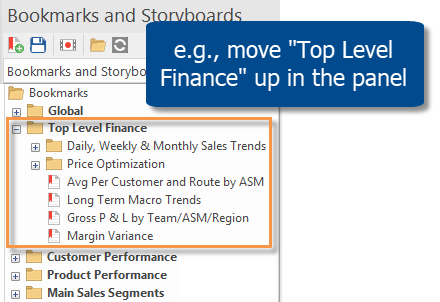
In addition, administrators can reorder user data categories to put the most important categories at the top. Reordering is done in the Administrator’s Utility; the custom order will then be visible in SIM.
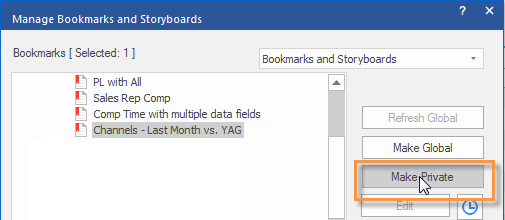
Create private copies of bookmarks and storyboards
You can easily create your own private copies of global bookmarks and storyboards. For example, create a private copy of a bookmark and then customize it for your own unique purposes.
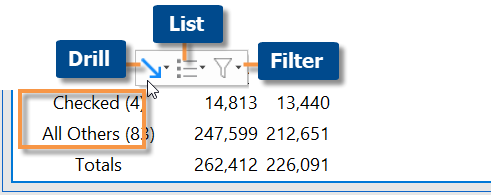
Enhancements for data investigation
This version makes it easier to investigate the data using the checkmark tool. Check the items you are interested in, and then drill, filter, or list, using new options in the contextual shortcut bar and filter menu. Just point and click to access these shortcuts.
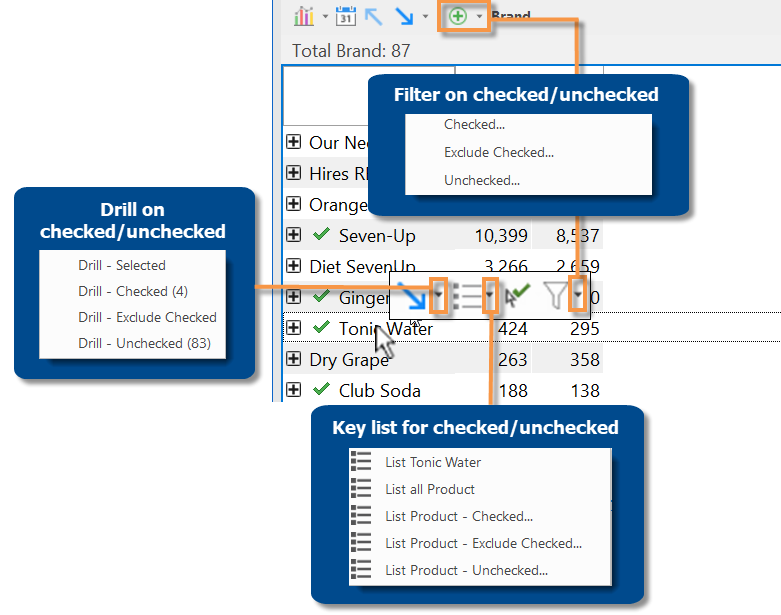
In addition, the subtotal rows provide new shortcuts for investigating checked or unchecked members. Just click in the row to access these options.
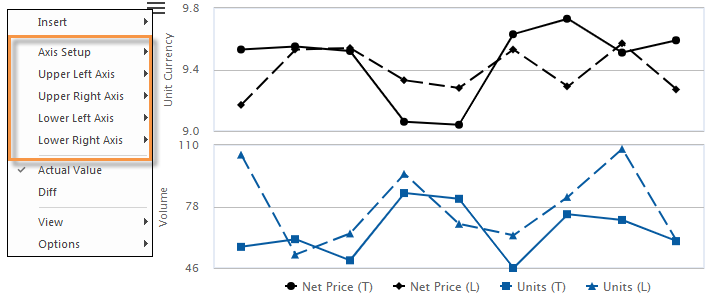
More options for comparing performance over time
You can graph values for multiple data fields across two different time periods in a Comparative Time Series graph. This type of graph was previous limited to a single data field at a time (e.g., sales volume only). You can now graph up to four different families of data (e.g., volume, total currency, unit currency, etc.) with each containing multiple data fields.
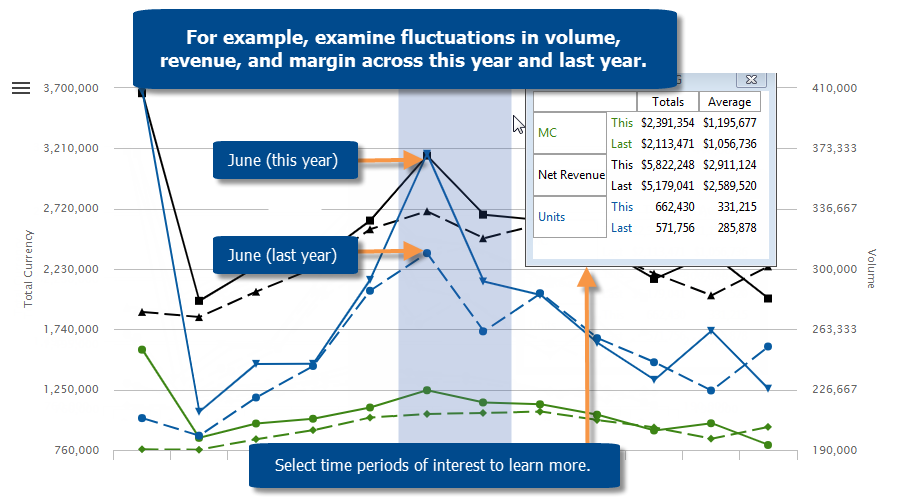
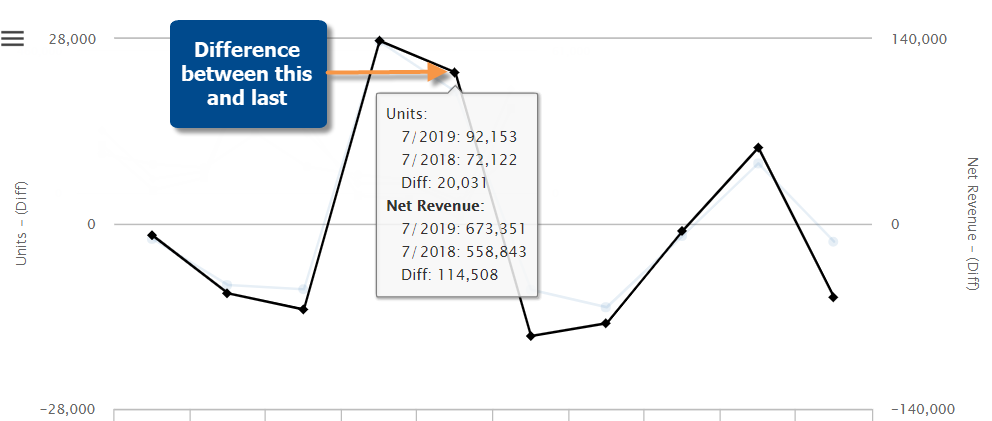
In Comparative Time Series graphs that show difference between values, you can see the difference between corresponding dates (this versus last) for multiple data fields at once.
Using the same options available for Trend graphs, you can choose where to place each data family (e.g., volume, total currency, unit currency, etc.)—along the left or right axis (up to two families per axis)—or use a split pane option.
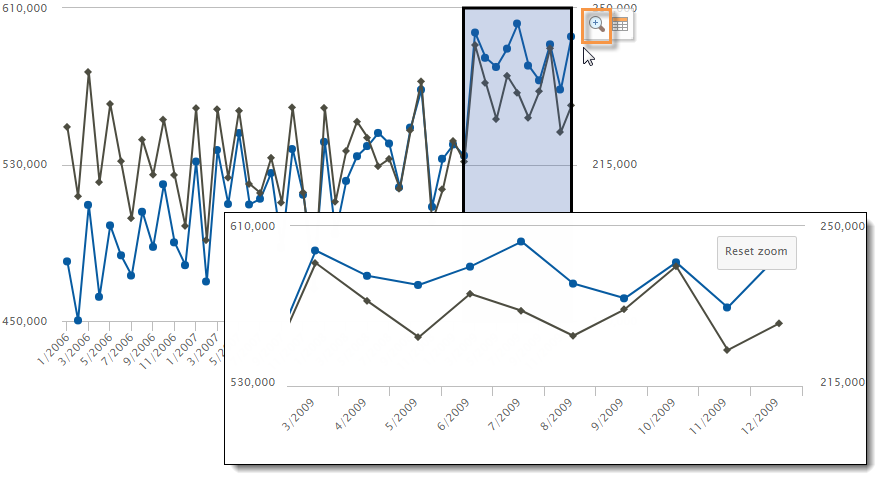
Zoom in on dates that interest you
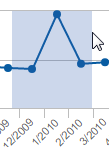
In performance trends, you can zoom in on a subset of the date range (e.g, a few weeks or months). Simply click and drag on the dates; then click the zoom button. For example, look at performance trends across multiple years and then zoom in on a time period of interest. This new feature is available in Normal Trend, Comparative Time Series, and Share Trend analyses.
Better control of date range windows
This version includes enhancements for managing date range windows, which show the details for subsets of the date range (e.g., a few weeks or months out of a longer time period). To access these options, click on at the top of the range window or click on the range in the graph.
- Each selected timeframe remains shaded in the graph to provide a visual indicator of the dates you are viewing. You can optionally turn the shading off (Remove Selection From Graph) to simplify the graph while leaving the date range window open.
- For any range window, highlight any corresponding date range in the graph to quickly identify it.
- For any date range in the graph, bring the corresponding date range window to the front.
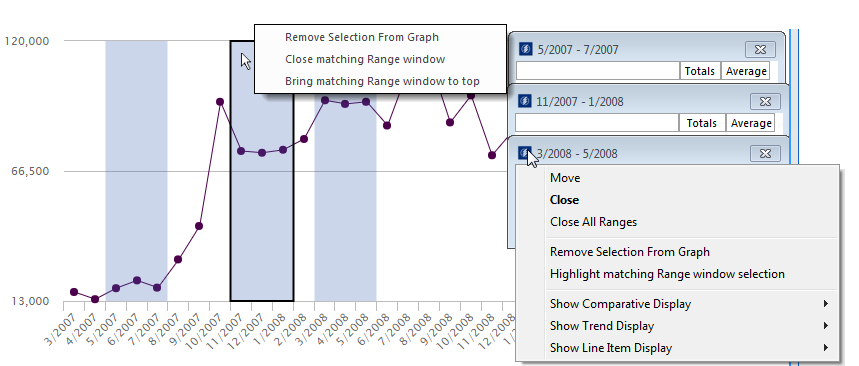
Because zooming is available in this version, the procedure for opening date range windows is slightly different. Click and drag (i.e., rubber-band) across the desired dates and then click the grid button in the shortcut bar.

Two-way graph enhancements
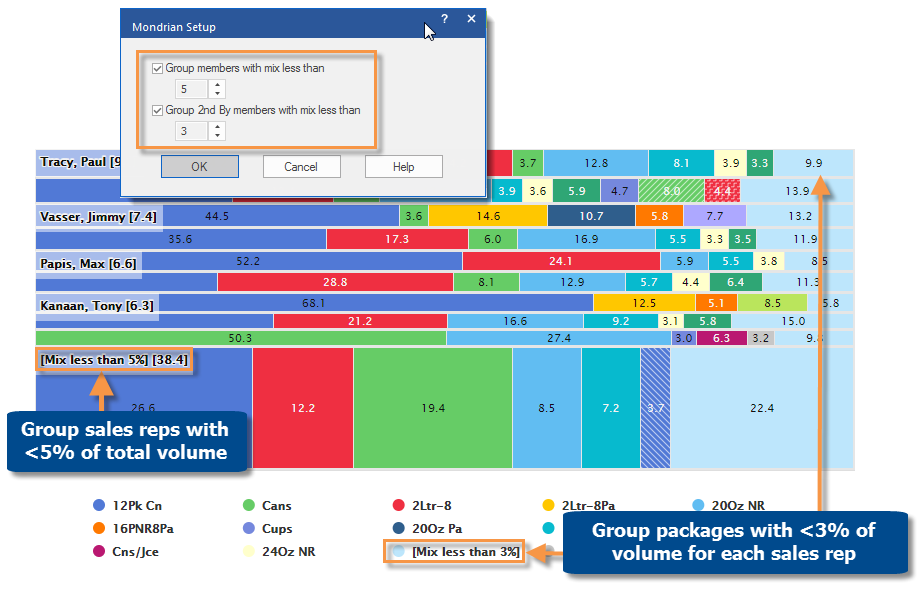
Fine-tune groupings of data
DeltaMap and Mondrian charts, which show data by two different attributes at once, have improved settings for grouping the less significant members together to simplify graphs. In this version, you can choose different thresholds for the 1st By and 2nd By attributes (e.g., 5% for the 1st By and 3% for the 2nd By). You can change these settings as needed to create customized visualizations of decision-support intelligence.
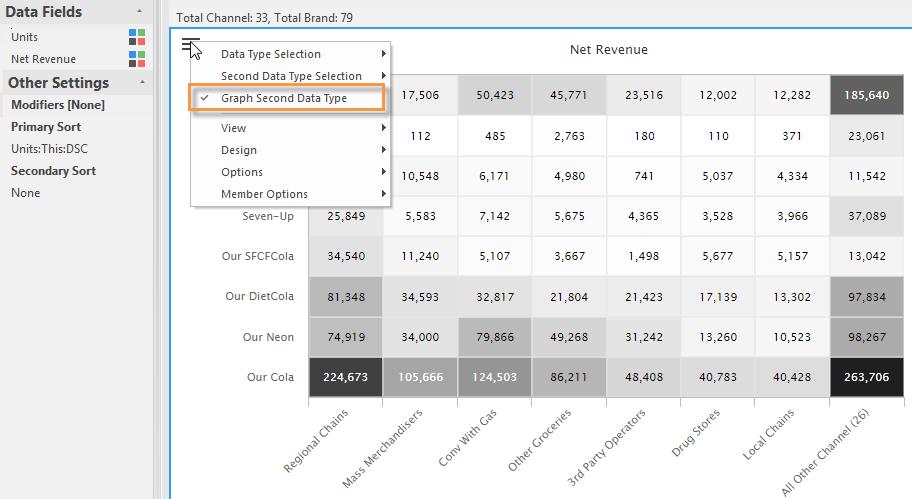
Easier data selection in two-way graphs
You can toggle between two different data fields in Crosstab graphs. Simply add the data fields and then choose which one to show using a new option in the tools menu. This option is available across several different graph formats, including Heatmap, Side-by-Side Bar, Stacked Bar, Mondrian, and more.
More options for Excel files
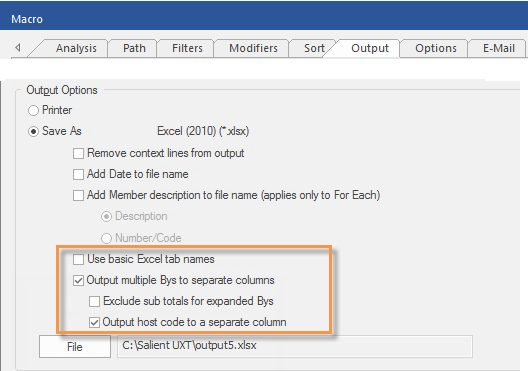
Unique settings for automated reporting
More settings can be applied on a per macro basis to meet all your data reporting and analysis needs. For example, include subtotals in some spreadsheets and omit them from others. In previous versions, these settings were applied globally across all macros.
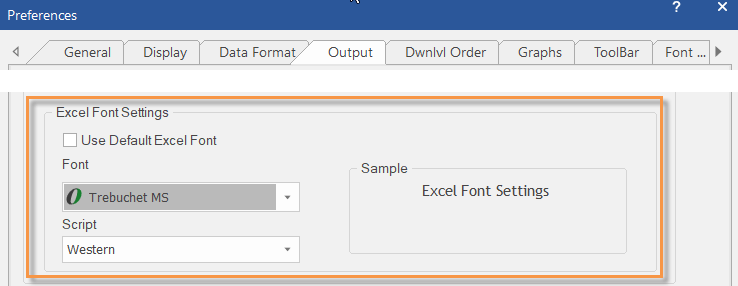
Excel font selection
You can choose the font and script to be used in Excel files. This new preference affects all Excel files created by SIM, including ad-hoc export (i.e. Save As) and macros.
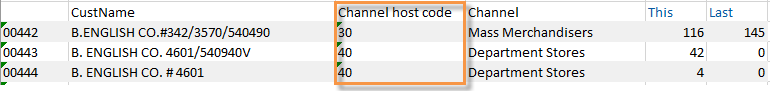
Improved output of host codes
In spreadsheets of key lists (e.g., customer lists), you can output separate columns for dimension host codes to help classify the data in the resulting files. To use this capability, the key list must include one or more dimensions with codes turned on as a prefix or suffix, and the “Output host code to a separate column” setting must be turned on—either in output preferences for ad-hoc exporting or macro output for automated reporting.
More authentication options
External/SSO authentication
This version supports external/SSO authentication using the new Salient Authentication Service and an external Identity Provider (IdP). In this configuration, SIM and other Salient client applications can authenticate users based on credentials from another system. This authentication method requires additional installation and configuration, including the Salient user data service.
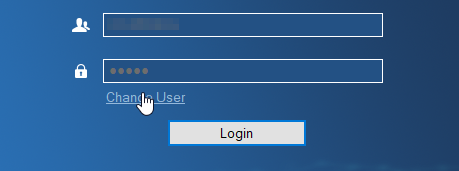
Flexible login for LDAP users
In LDAP configurations (i.e., authentication based on machine login), a new option allows you to change the user account for SIM login. For example, enter your own SIM credentials on a shared machine. To access this new option, select Change User in the login screen.
Custom reporting (BETA)
Custom reports can be built into your solution by Salient to address specific business needs. For more information, contact your Salient sales representative.
Version compatibility:
Required Server/Metaserver version: 6.0.222 through 6.0.232 In general, the latest V6 server (currently V6.0.232) is recommended.
Compatible Salient Dashboard versions: 7.50 through 7.80
Learn more about SIM versions: