Improved phone layouts (in 1.11.3)
Phone layouts are intelligently designed by default—requiring less setup to make them consumable on phones and other devices in the mobile app. For example, widgets are full-width and arranged one above the other. Also, some widgets are hidden by default to save screen space. New dashboards will use this default layout. For existing widgets, Dashboard Designers can quickly apply this design in the Salient Dashboards browser application.
Optional location filtering (in 1.11.3)
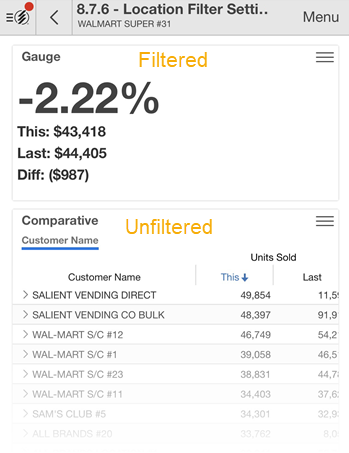
Dashboard designers can turn off location filtering for an individual widget, so you can filter by location in one place but not another. For example, see filtered values for a nearby customer together with an unfiltered list of all customers.
Go directly to a tab using a link (in 1.11.3)
If a dashboard link includes a tab parameter, it will take you directly to a specific tab in the mobile app. This capability was previously only available in the Salient Dashboards browser application.
Easier location panel setup (in 1.11.3)
Administrators can configure settings for the mobile location panel, such as fields to display and number of results, in the Admin Portal; local access to the mobile configuration file is not required.
Refresh dashboards
A new icon lets you synchronize dashboards with the Salient Dashboards browser application at any time without logging out of the mobile app.

Support for Salient Dashboards Version 8.7
This version supports enhancements in Salient Dashboards Version 8.7.
Contextual information about filters*
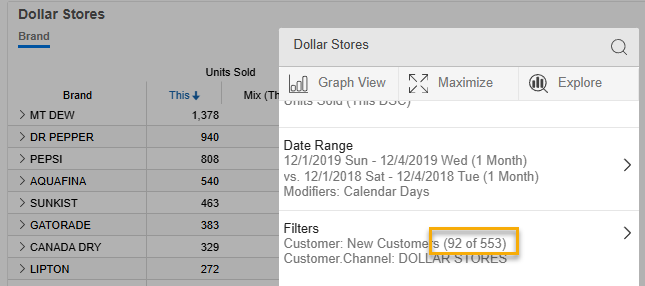
You can see contextual information about key-level widget filters (e.g., sets of customers), including the number of members that match the current context and the total number of members possible in the filter. For example, a widget might show data for 92 out of 553 new customers when filtered on a certain store type. This feature requires additional setup.
Sync dates in Multi Comparative columns*
A new option synchronizes the dates, so columns update together when a user changes the timeframe—making it easier to compare different parts of the dataset across multiple columns.
Share Trend improvements
- Show multiple measures at once
- Auto-expand data to additional levels of detail
- Show percent of total (mix)


Granular data in Crosstab analyses
- Auto-expand data to additional levels of detail
- View key-level data (e.g., by customer or product)

Dynamic filter enhancements*
- Text-based criteria (e.g., name or description)
- Test at the dimension level

Totals at the top of grids*
The new option shows summary data at the top.

Highlighting in test-based analyses (exception)*

Custom groups of key level data*
Compare custom groups of customers, products and other key entities. This feature was previously only available at the dimension level.

Custom comparisons for incomplete timeframes*
Weighted day tables can provide custom comparisons of incomplete data versus a year ago. This feature adjusts the data for the previous date range based on a percentage of the current month or period that is expected to have occurred by a given date.
* Must be pre-built into the dashboard
Version compatibility:
Requires Salient Dashboards Version 6.20 or higher. The latest version of Salient Dashboards is recommended to take advantage of recent enhancements.
Learn about other Salient Mobile versions: